eBay's Financials
Following are some of eBays financial results for the past four years.
Because the online auction market is about connecting people there is no traditional retailing cost structure. From that fact eBay can be expected to have more impressive profit margins than "old economy" companies, which is the case as can be seen in the table here below.
The Cash King Margin (CKM), which is calculated by dividing the difference between Operating cash flow and Capital expenditures by Sales, gives an indication of the company's cash generating power — it gives a clearer indication than net income, since net income is usually "tainted" by interest and other non-operating figures. For eBay, the CKM is 8.8% (given $99 million generated and $60.7 million spent) which compares very favorably to Motley Fools rating of CKM of 10% in mature "Rule Maker" companies.
| Income Statement |
FY 1997
|
FY 1998
|
FY 1999
|
FY 2000
|
| Sales |
$41,370
|
$86,129
|
$224,724
|
$431,424
|
| CoGS |
8,404
|
16,094
|
57,588
|
95,453
|
| Gross Profit |
32,966
|
70,035
|
167,136
|
335,971
|
| Gross Margin |
79.69%
|
81.31%
|
74.37%
|
77.87%
|
| Sales & Marketing |
15,618
|
35,976
|
96,239
|
166,767
|
| Product Development |
831
|
4,640
|
24,847
|
55,863
|
| General & Administrative |
6,534
|
15,849
|
43,919
|
73,027
|
| Operating Income |
9,983
|
12,765
|
-3,373
|
34,994
|
| Operating Margin |
24.13%
|
14.82%
|
-1.50%
|
8.11%
|
| Net Income |
7,061
|
7,273
|
9,567
|
48,294
|
| Diluted Net EPS |
$0.08
|
$0.06
|
$0.04
|
$0.17
|
(all numbers except EPS are in thousands)
Looking at the Balance Sheet and using Motley Fools' Flow Ratio, which is defined as
(Current assets - Cash) / (Current liabilities - Short term debt)
measures the performance of eBay's working capital on a day-to-day basis. The lower the number, the better. A Flow Ratio of below 1.25 is considered to be attractive, but eBay does even better with a Flow Ratio around 0.90 for the first three quarters of 2000 and 0.76 in the fourth quarter.
| Balance Sheet |
12/31/97
|
12/31/98
|
12/31/99
|
12/31/00
|
| Cash & Equivalents |
$3,723
|
$37,285
|
$221,801
|
$201,873
|
| Short-term Investments |
0
|
40,401
|
181,086
|
354,166
|
| Receivables |
1,024
|
12,425
|
36,538
|
67,163
|
| Total Current Assets |
4,967
|
97,590
|
465,307
|
675,464
|
| Long-term Investments |
0
|
0
|
373,988
|
218,197
|
| Net Fixed Assets |
652
|
44,062
|
112,202
|
125,161
|
| Total Assets |
5,619
|
149,536
|
969,825
|
1,182,403
|
| Accounts Payable |
252
|
9,997
|
32,133
|
31,725
|
| Total Current Liabilities |
1,124
|
24,656
|
93,041
|
137,442
|
| Total Liabilities |
1,586
|
48,998
|
115,696
|
168,643
|
| Total Equity |
1,105
|
100,538
|
852,467
|
1,013,760
|
(all numbers are in thousands)
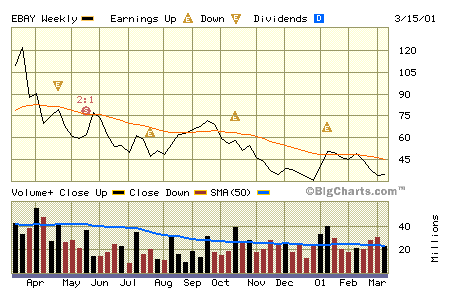
eBay's stock price has suffered along with all other Internet stocks, as can be seen here below although comparatively it has faired better than most other Internet stocks.

Project for IEF248a
Spring 2001
Magnus Bjornsson