next up previous
Next: Measuring Progress in Coevolution Up: Learning Previous: Evolution as Learning

Human Behavior

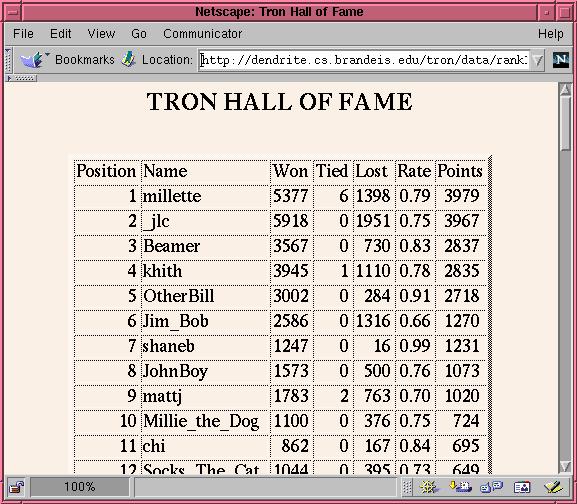
Why would humans want to continue playing Tron? One mechanism we devised for attracting ``web surfers'' and enticing them to keep coming back is our ``Hall of Fame'' (fig. 3.14).

  
Figure 3.14: Snapshot of the Tron ``Hall of Fame'' web page (9/4/00). Players win a point for every game won, and lose one per game lost. We encouraged achieving immortality by playing more games, and winning, rather than having the best winning rate.


The hall of fame, or ranking, is a form of bringing up competition between humans into a game that otherwise is played in isolation.
  
Figure 3.15: Composition of human participants. Human players were divided in four groups: novices, who have played up to 10 games (1); beginners, 11 to 100 (2); seasoned, 101 to 1000 (3); and veterans, more than 1000 (4). From the beginning of the experiment all four groups represent large parts of the totality of games.

\resizebox*{0.7\textwidth}{!}{\includegraphics{aftermath2/ts2f20.eps}}


Figure 3.15 shows that we have consistently attracted groups of veteran players along with a steady stream of new participants. The presence of seasoned humans helps us get an accurate evaluation of agents, but novices were necessary, at least in the beginning, to discriminate between agents who could have lost all games against an expert. Figure 3.6 shows horizontal lines which represent some of the veterans, coming back again and again over long time spans. The more such players are present, the more accurate is the computation of RS indexes.

Is the human species getting better as well? No. Redoing the same exercise of figure 3.12, but now tracing the strength level of all human players considered as one entity, we obtain a wavy line that does not seem to be going up nor down (fig. 3.16). This shows that, although individual humans improve, new novices keep arising, and the overall performance of the species has not changed over the period that Tron has been on-line.

  
Figure 3.16: Performance of the human species, considered as one player, varies strongly, complicating things for a learning opponent, but does not present overall trends (compare to fig. 3.12).

\resizebox*{0.7\textwidth}{!}{\includegraphics{sab00/graph/ts2f08.eps}}


An altogether different image emerges when we consider humans on an individual basis. Although a large number of games are needed to observe significant learning, there is an important group of users who have played 400 games or more. On average, these humans raise from a performance of -2.4 on their first game, to -0.8 on their 400th game, improving approximately 1.5 points over 400 games (fig. 3.17). The learning rate is dramatically faster for humans, compared to the approximately 100,000 games (against people) that our system needed to achieve the same feat (fig. 3.12).

  
Figure 3.17: Average human learning: RS of players' n-th games up to 400. A first-timer has an estimated RS strength of -2.4; after a practice of 400 games he is expected to play at a -0.8 level. Only users with a history of 400 games or more were considered (N=78).

\resizebox*{0.7\textwidth}{!}{\includegraphics{sab00/graph/ts2f131.eps}}


On fig. 3.18 we have plotted the learning curves of the 12 most frequent players. Many of them keep learning after 1000 games and more, but some plateau or become worse after some time.

  
Figure 3.18: Individual learning: strength curves for the 12 most frequent human players (curves start at different x values to avoid overlapping). All users change; nearly all improve in the beginning, but later some of them plateau or descend whereas others continue learning.

\resizebox*{0.7\textwidth}{!}{\includegraphics{sab00/graph/ts2f212.eps}}


next up previous
Next: Measuring Progress in Coevolution Up: Learning Previous: Evolution as Learning
Pablo Funes
2001-05-08